Setting-up Sitecore Analytics Dashboards part 1: It’s not that easy after all
Who doesn’t love them, the colorful graphics and charts in various shapes and forms that deliver a range of information to understand website users and to continually improve the product range based on elaborate statistical evaluations. We are talking about those charts and numbers that inform about the use of an internet platform, reaching goals and conversions, e. g. a purchase in an online shop, and many more insights. And it’s not even possible without this information. Because the factors that are really relevant for the success of a website have to be measurable. At Cocomore we therefore don’t just trust our gut feeling when it comes to identifying highlights and weaknesses of a web presence, but instead we count on corresponding analytical tools. This is mainly Google Analytics. But many CMS platforms have their own analytics suites, like Sitecore.
Presentation in the Launchpad
The Sitecore Analytics Dashboard is displayed in the launchpad of Sitecore 8. This launchpad is the surface that is displayed by default after signing in to CMS. In contrast to previous Sitecore versions, where you could choose between content editor (default selection), desktop and launchpad when logging in, the launchpad is the interface from which you carry out your work in CMS. Desktop and content editor are still accessible from here. Although the desktop has actually lost its reason for being since now everything is accessible from the launchpad. But of course this is a matter of personal taste as well.
The Dashboard
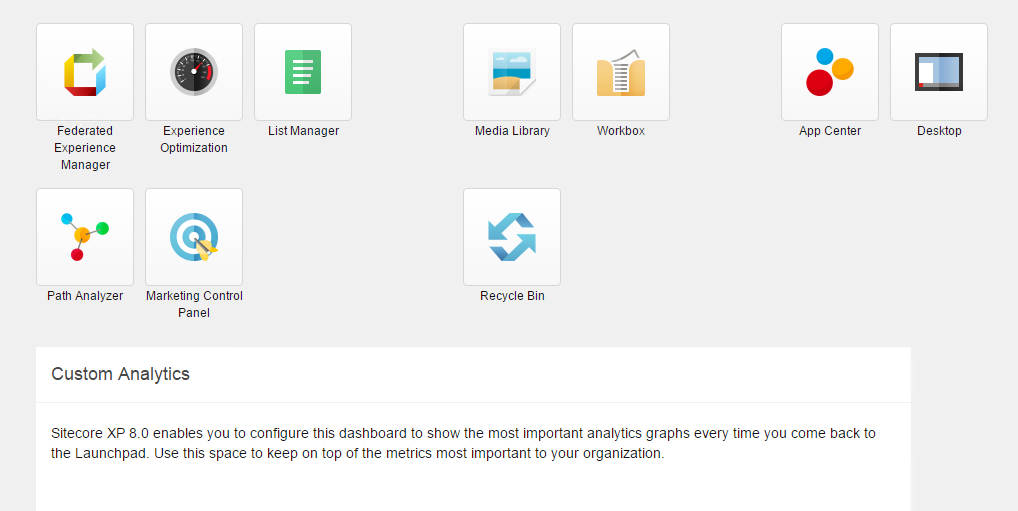
But let’s get to the actual topic, the Analytics Dashboard. In my Sitecore 8 installation, which serves its purpose for writing blog posts but also for a safe trial of new modules etc., it looks like this:

Graphic 1: Analytics Dashboard in Sitecore 8
Where I am actually expecting exciting data about the use of my website, unfortunately it only says:
“Sitecore XP 8.0 enables you to configure this dashboard...”
Well. Would it be too much to ask to show at least some basic information, which I then can adjust and complete according to my wishes - e. g. how many hits my website has had lately? Although admittedly traffic has most likely been limited, since I am the only visitor. Either way, at least this piece of information, that nobody has visited, could be presented to me by the dash board.
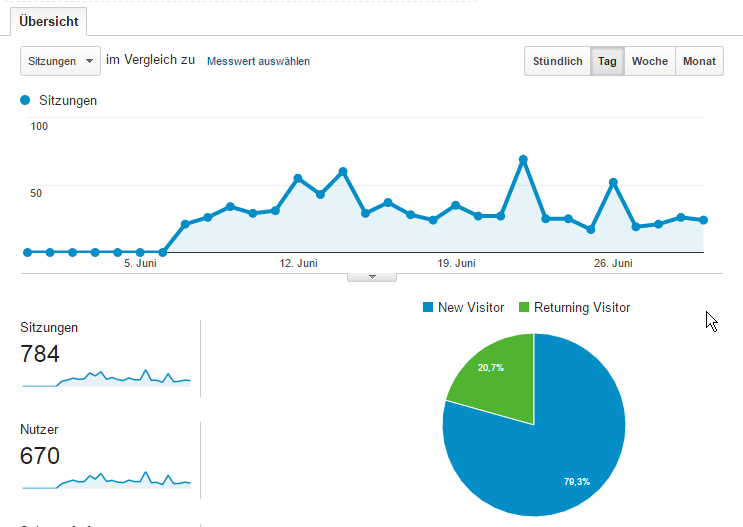
Google Analytics can do this “out of the box”. The question arises anyway why you should count on a Sitecore solution while you have a powerful and free alternative available with Google Analytics that can offer a wide range of information with little effort. And which additionally provides a clear and comfortable, browser-based configuration interface with the Google Tag Manager.
Another big advantage of the Google platform is definitely the option to link data from the various Google advertising programs, e. g. age, gender or preferences, etc.

Graphic 2: Dashboard (extract) in Google Analytics
I expected something along those lines for my Sitecore Analytics dashboard as well, instead of the succinct request to please configure something for myself. Is this approach even promising or are my expectations set way too high?
By entering “Sitecore Analytics Dashboard” in Google I did get some promising results after all:

Graphic 3: Image search in Google
Yes, there they are, colorful numbers and graphics: Lines, pie charts and bar diagrams, tables, so everything that lets the heart of an analytics enthusiast skip a beat. But before we get to the practical use of this information, to begin with some theoretical information concerning data generation:
No SQL
One of the significant changes in Sitecore 8 compared to its predecessor was the conversion of the analytics data retention. From time to time analytics data, just like everything else in Sitecore, was saved in a Microsoft SQL data base. Sitecore has always enticed with the collation and analyzing of data and presented it as an important and unique selling point. Of course the technical basis has to be given accordingly. For this reason, you gradually got to the limits of what made sense and was doable with the SQL server. With the establishment of the so-called NoSQL data base a corresponding alternative came to life.
Instead of filing information in charts with a fixed width, i. e. always with the same number of columns, as with standard relational data base systems, NoSQL offers a much broader flexibility in regards to this. But the ability of NoSQL systems to deal with large amounts of data and being able to scale very well horizontally are just as important.
MongoDB
So, since version 8 Sitecore uses MongoDB, a popular implementation of the NoSQL concept for storing analytics data. But the MongoDB system has to get installed and configured separately. For this reason a correct and functioning installation is a crucial requirement for the collation of analytical data. That’s all that has to be done. The rest, e. g. creating data bases, is done by Sitecore “on the fly”.
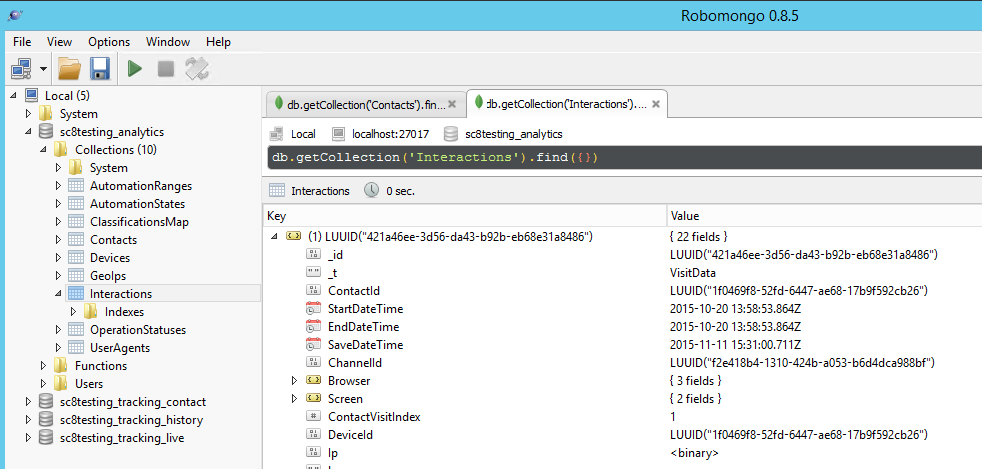
Once this hurdle is taken you should check whether the information comes in correctly. A good tool for working with MongoDB is Robomongo. Which then looks like this:

Graphic 4: View of analytics data bases in Robomongo
The pattern is not necessarily intuitive, but it only has to be understandable for the Sitecore implementation. Still, when taking a closer look you find some information that seems familiar, e. g. via the browser used. But also strange somehow:

Error:
“Sitecore.Analytics.DataAccess.DatabaseNotAvailableException”: Database not available
The question arises of how this could be written into the data base? Oh well, you don’t have to understand everything…
So basically the whole thing is looking good. But when taking a closer look at the date of the entries, they are from last year.
Experience Analytics
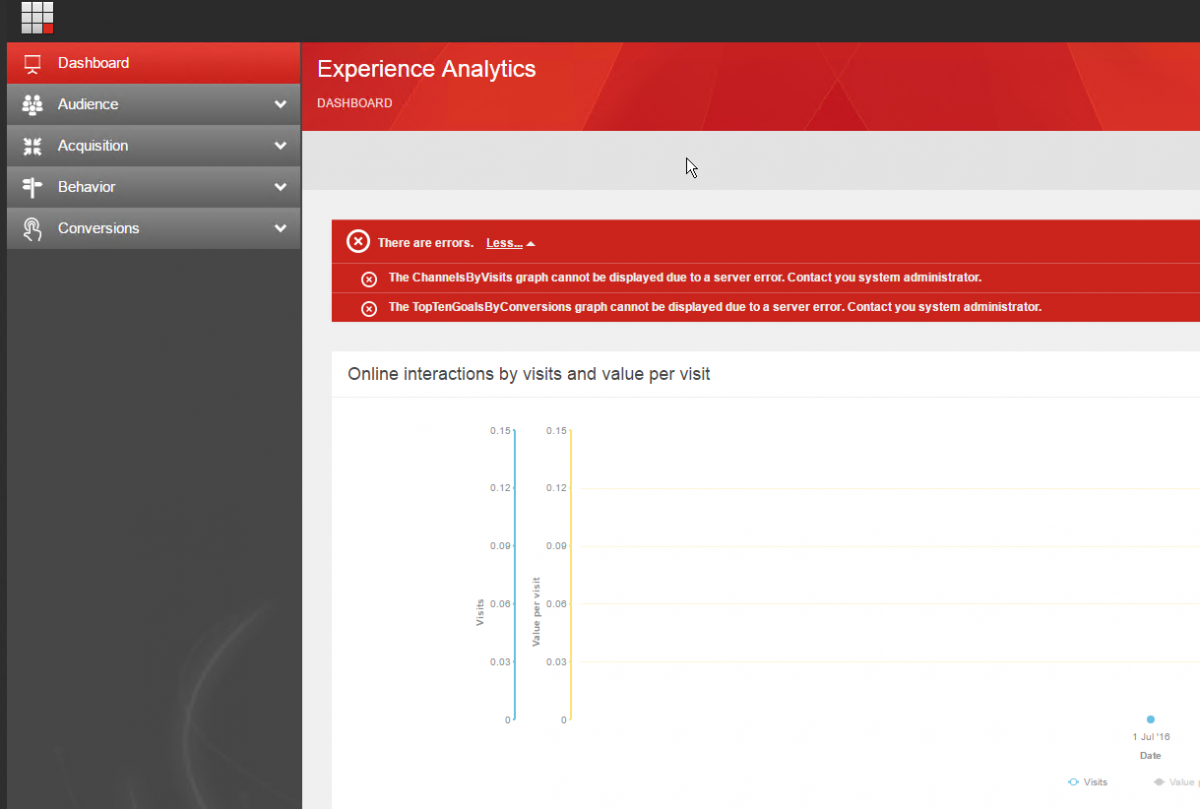
Although I actually want to configure my Analytics Dashboard, this is only the summary of analytics data how I would like to have it at a glance when I sign in. So, the short version. The long version is in the Experience Analytics application, which I can open from the Sitecore Launchpad. Here I initially want to make sure that the information merges correctly:

Graphic 5: Sitecore Experience Analytics Dashboard
This doesn’t look good. I have limited the analytics time frame to today in order to get a better overview, typed in the home page in the browser a few times and - nothing. No data. In addition even an error message:

„Contact your system administrator“. Very funny. So I’ll go ahead and contact myself.
Result
The initial euphoria has made room for the disenchanting realization that apparently something has to be quite wrong with my Analytics System. It would’ve been too good to be true anyway if everything had worked out right away. So, I don’t have any analytics data, not to mention an analytics dashboard.
Seems like I will have to dedicate one of my next blog posts to the solution of the actual problem and the configuration of my analytics dashboard (finally!).


